Analyzing 2022 flight delay trends using Python
25 November 2025 | Jacob Liu
Since Thanksgiving is coming soon, I decided to analyze flight delay trends for air traffic in 2022. Flight delays are very common during the holiday season, and I wanted to see if I could identify any interesting patterns. I also used this mini-project as an opportunity to practice my Python and pandas skills. You can find the full code for this project in my github repository here.
First, let's take a look at the dataset. The dataset contains information per month for every airline for airports in the United States. You can find it on Kaggle here. To begin, I checked for the amount of delays for the entire country per month. Delays are defined as delays of 15 or more minutes. Here is a bar chart showing the total number of delays per month in 2022:
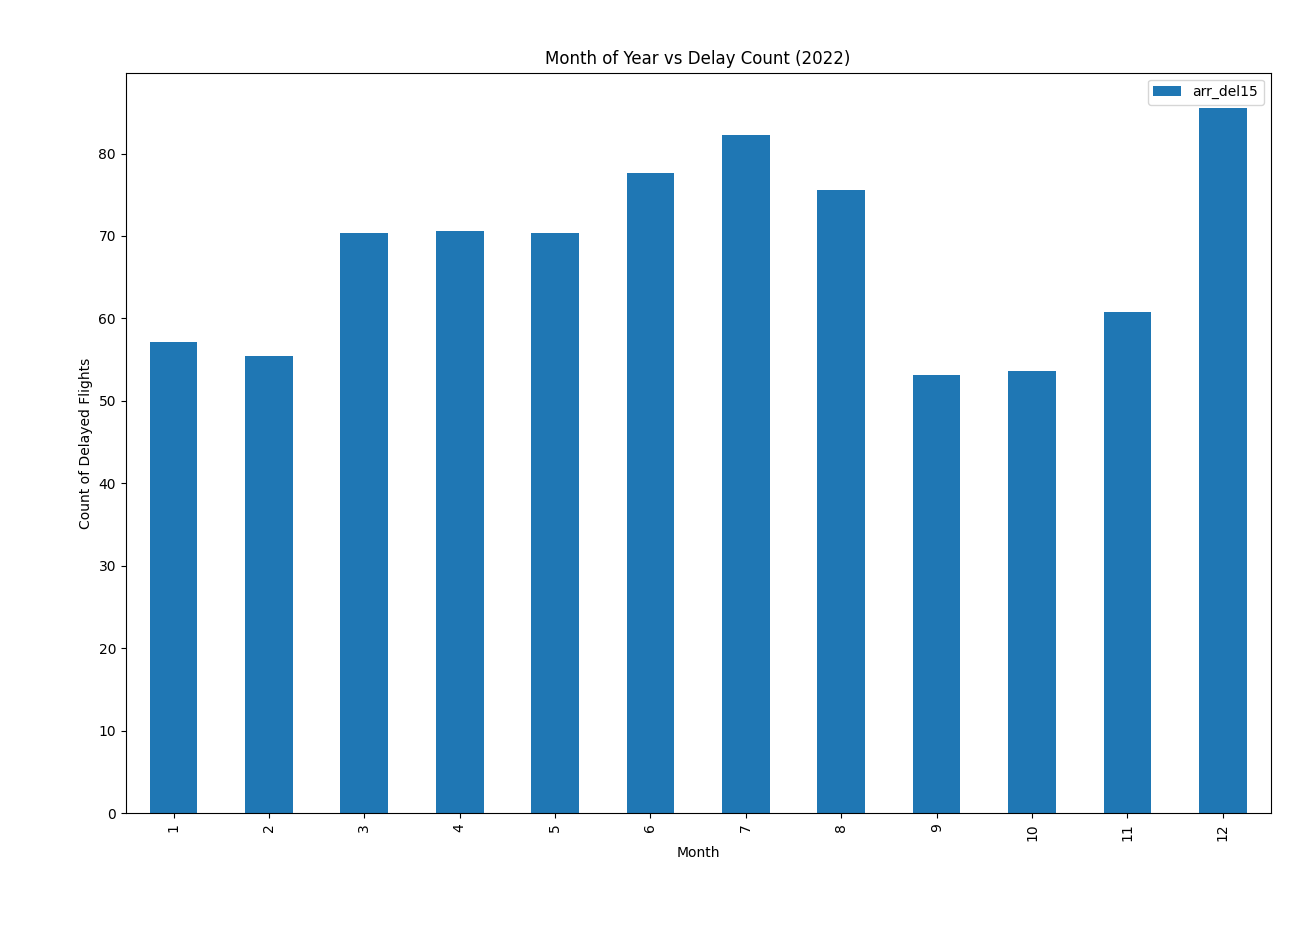
From this, you can already derive some interesting patterns. The months of July and Decemver have the highest amount of delays, which represents the holiday months. June and August have the second highest amount of delays. Interestingly, March through April have similar delay rates, all of which are higher than November. I would've thought that November would have higher delays due to Thanksgiving, but it seems that the delays are more concentrated in December. This bar chart doesn't tell the full story, though. Let's break down the delays by cause of delay.
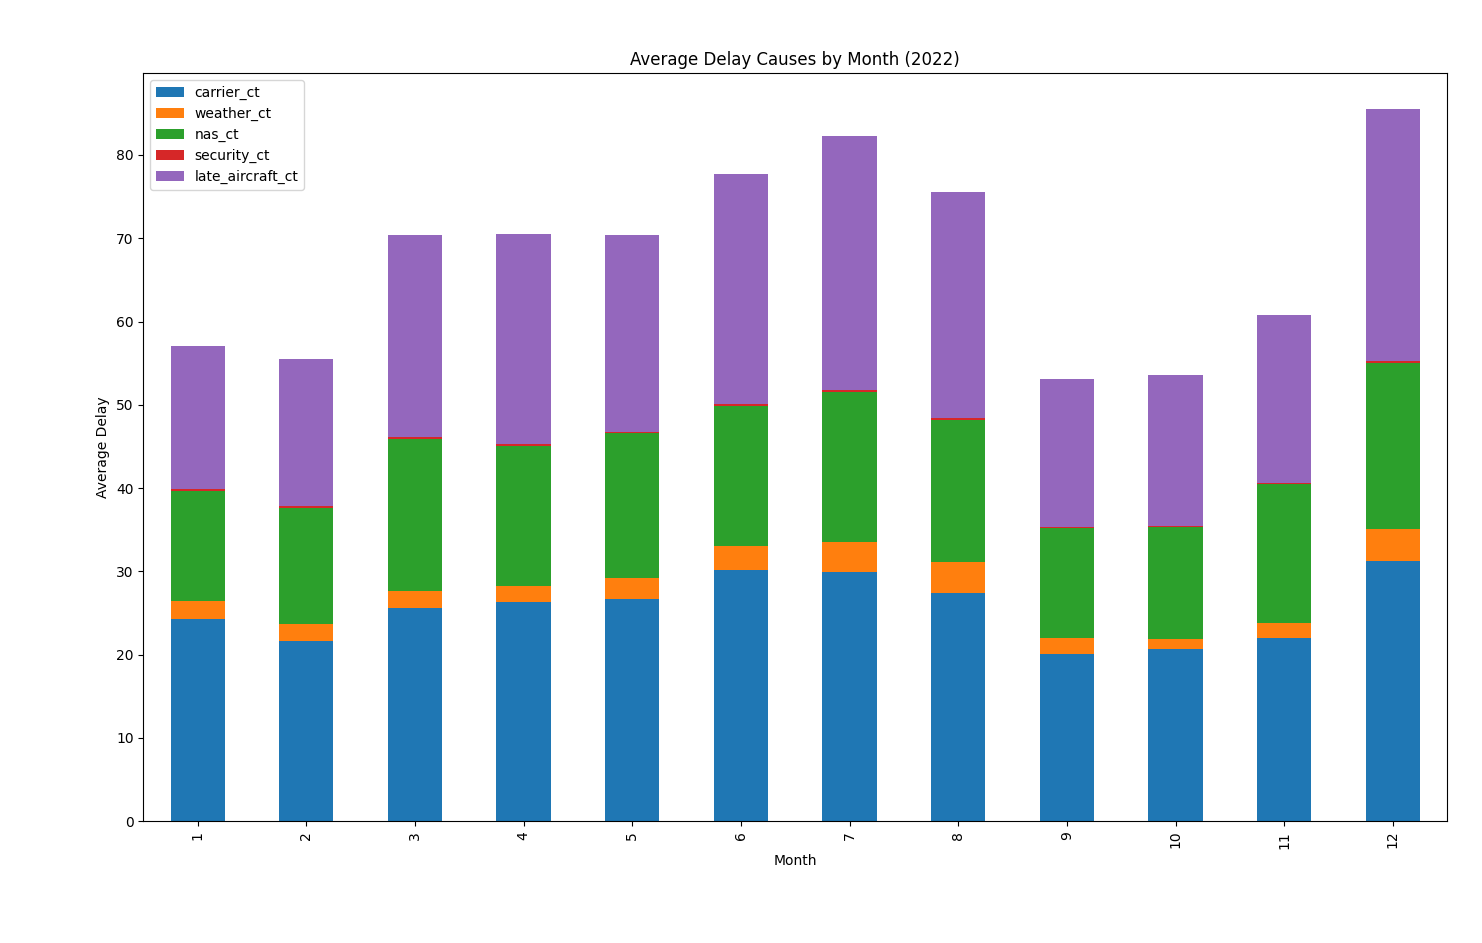
carrier_ct refers to delays caused by the airline carrier. We can see that this follows the same trend as total delays, with July and December having the highest delays. Larger amounts of passengers most likely leads to more stress on the airline and can cause cascading delays. weather_ct refers to delays caused by the weather. Interestingly, it doesn't make up a huge portion of delays like I thought it would. It seems more consistent throughout the year, with spikes in the winter and summertime. Obviously, a spike in weather related delays in the winter is most likely due to snowstorms out in the northeast, while the summer spike is most likely due to thunderstorms. security_ct refers to delays caused by security issues, late_aircraft_ct refers to delays caused by late aircraft and nas_ct refers to delays caused by the national aviation system. These two causes of delay seem to be more consistent throughout the year, with slight increases in the summer months.
Now let's take a look at airports individually. To start, let's identify the airports with the most and least delay rates relative to their total passenger flow. In order to cull out the small airports, where theres often only a few passengers per day, I only considered airprots with 50,000 or more total passengers in 2022. First, I found the top 10 airports with the highest delay rates:
- MCO - Orlando
- EWR - Newark
- FLL - Fort Lauderdale
- TPA - Tampa
- LAS - Las Vegas
- JFK - New York
- MIA - Miami
- DAL - Dallas Love Field
- BOS - Boston
- MDW - Chicago Midway
This is very interesting. Firstly, we can see that Florida airprots and New York airports dominate the list. This is most likely due to the high volume of tourists visiting these locations, especially during the holiday season. Orlando, Fort Lauderdale, and Tampa are all popular vacation destinations, while New York is a major hub for both business and leisure travel. Additionally, airports like Newark and JFK are known for their high traffic volumes and congestion, which can lead to delays. Something I was not expecting was DAL and MDW to be on this list. They are both the smaller airport counterparts to their larger city airports (DFW and ORD, respectively). You always hear about congestion at airports like Dallas Forth-Worth and Chicago O'Hare, but it seems that the smaller airports also experience significant delays.
These airports also have various reasons for their delays. I decided to graph the type of delays for these top 10 airports to see what happened:
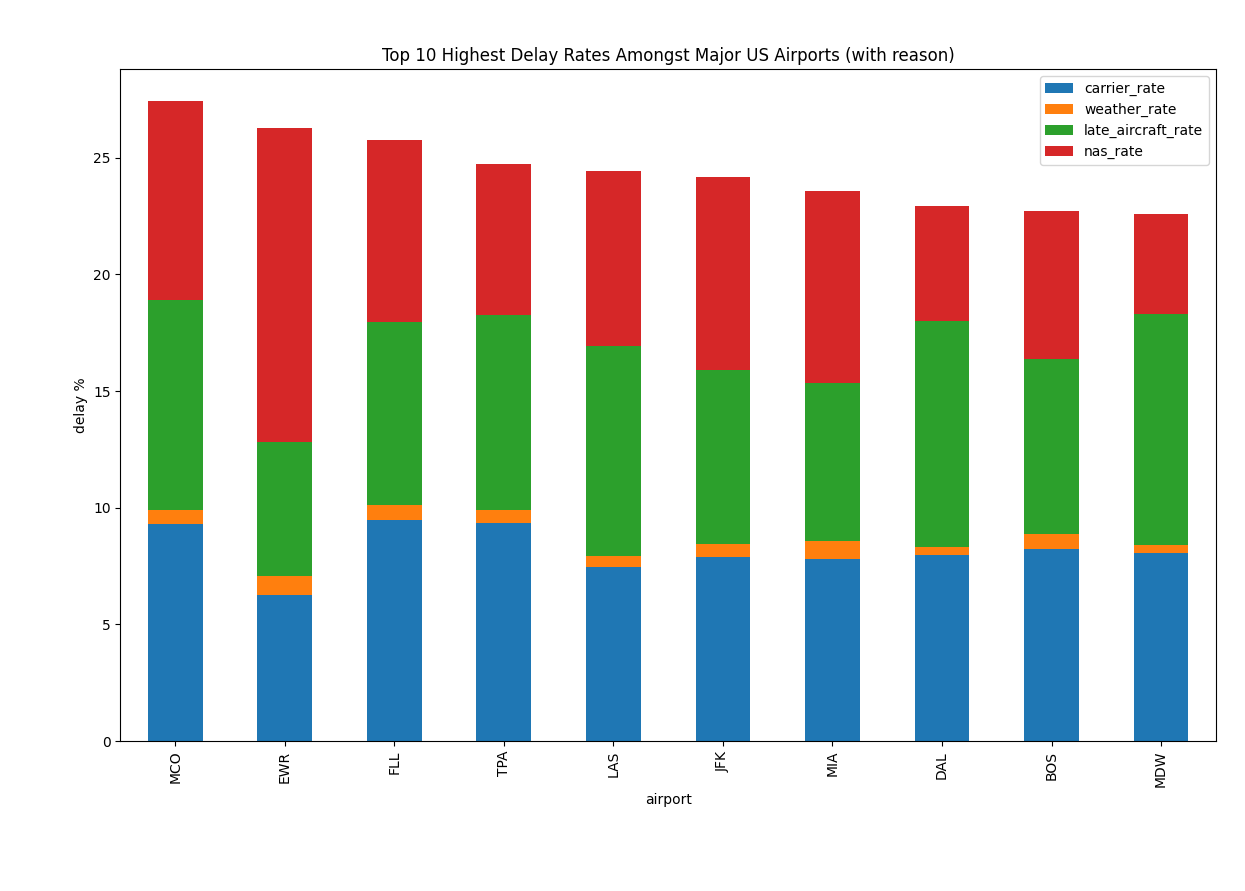
Immediately, I noticed the large difference in nas_ct at EWR. This refers to the national aviation system, which includes air traffic control and airport operations. Newark is known for its congestion, especially due to its proximity to LGA and JFK, two other major New York airports, which explains this difference. The carrier_ct is lower at EWR but higher at Florida airports, which may signify that airlines focus their operations on hubs like Newark. Overall, this chart shows the variety of delay causes at different airports.
Now, let's take a look at the airports with the lowest delay rates. Here are the top 10 airports with the lowest delay rates:
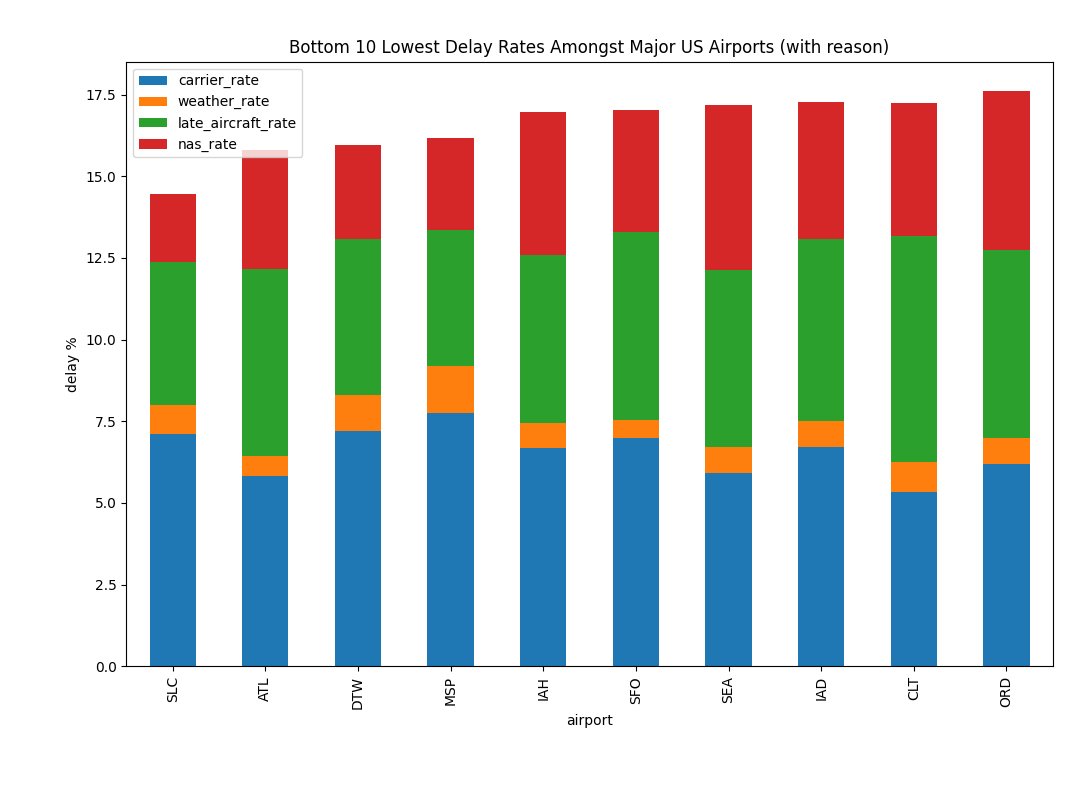
This is also very fascinating. Firstly, Chicago O'Hare is on this list, contradicting the previous observation about Midway. ORD is a massive hub with a ton of traffic, making it highly impressive that it is able to keep a low delay rate. MSP has a very high percentage of weather related delays, most likely caused by its location in snowy Minnesota, but still keeps a strong overall delay rate. Another very impressive airport is Atlanta, the busiest airport in the world by passenger traffic. ATL serves as the primary hub for Delta Airlines, which may explain its low delay rate. In fact, many of these airports are major hubs to Delta Airlines specifically. ATL, MSP, DTW, SLC and SEA are major Delta hubs, making up 5 of the lowest 10 delay rate airports. United Airlines also makes an appearance with IAH, SFO, IAD and ORD, while American Airlines has CLT. This may signify that airline hubs have better operations and efficiency, leading to lower delay rates.
If you want to play around with this data or see some more graphs, check out the Github repo I posted above. Overall, this was an interesting project to conduct. I also used it to sharpen my Python and pandas skills, which I hope to use in more interesting projects in the future. Happy Thanksgiving!